This function examines the quality-control ("QC") flags within an argoFloats
object that was created by readProfiles(). By default, it replaces all suspicious
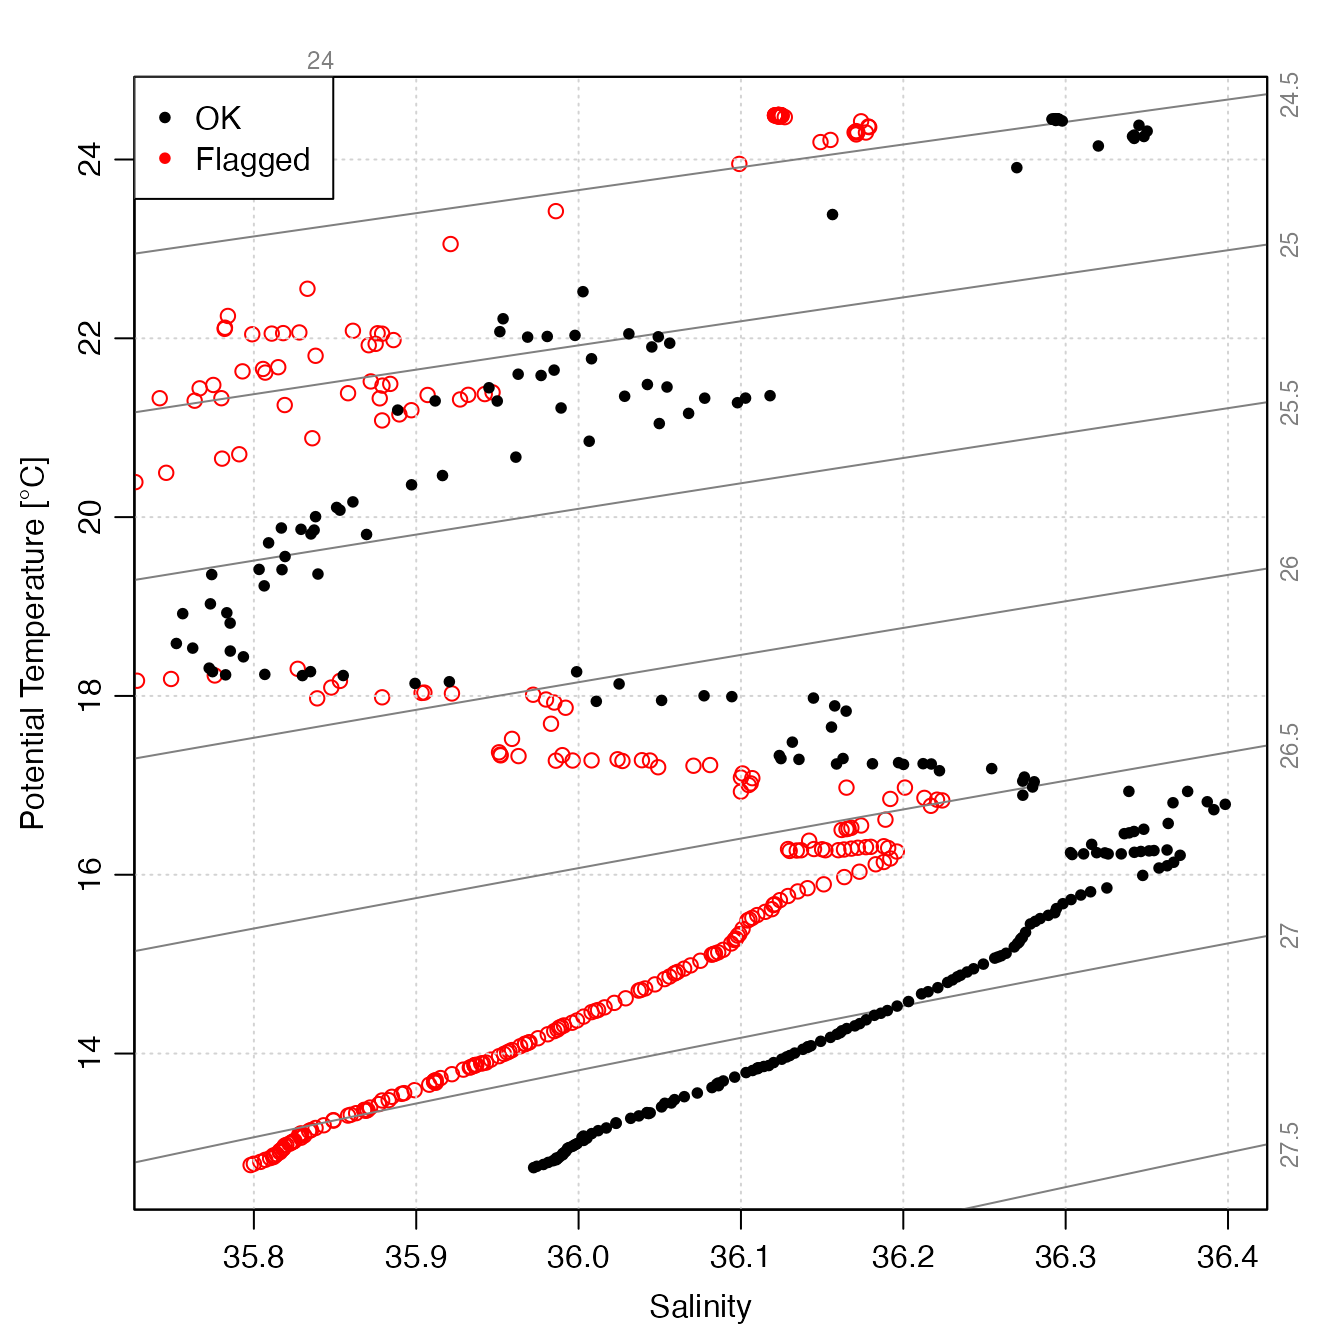
data with NA values, so they will not appear in plots or be considered in calculations.
This is an important early step in processing, because suspicious Argo floats commonly
report data that are suspicious based on statistical and physical measures, as
is illustrated in the “Examples” section.
See section 3.3 of Kelley et al. (2021) for more information
about this function.
applyQC(x, flags = NULL, actions = NULL, debug = 0)Arguments
- x
an
argoFloatsobject of type"argos", as created byreadProfiles().- flags
A list specifying flag values upon which actions will be taken. This can take two forms.
In the first form, the list has named elements each containing a vector of integers. For example, salinities flagged with values of 1 or 3:9 would be specified by flags=list(salinity=c(1,3:9)). Several data items can be specified, e.g. flags=list(salinity=c(1,3:9), temperature=c(1,3:9)) indicates that the actions are to take place for both salinity and temperature.
In the second form, flags is a list holding a single unnamed vector, and this means to apply the actions to all the data entries. For example, flags=list(c(1,3:9)) means to apply not just to salinity and temperature, but to everything within the data slot.
If flags is NULL then it is set to
list(c(0,3,4,6,7,9)), which means to eliminate data that are considered bad (in some degree) or for which QC was not performed. Following Section 3.2.1 of reference 1, the flag meanings are as follows.0: No QC was performed
1: Good data
2: Probably good data
3: Bad data that are potentially correctable
4: Bad data
5: Value changed
6: Not used
7: Not used
8: Estimated value
9: Missing data
- actions
the actions to perform. The default,
NULL, means to use the actions set up byreadProfiles(), which, by default. causes any data flagged as suspicious to be set toNA.- debug
an integer passed to
oce::handleFlags,argo-method(). If this is set to a positive value, then some debugging information will be printed as the processing is done.
Value
A copy of x but with each of the objects within its data slot
having been passed through oce::handleFlags,argo-method().
Details
The work is done by using oce::handleFlags,argo-method()
on each of the profiles stored within the object. In most cases, only
the object needs to be specified, for the default actions coincide with
common conventions for flags in Argo data.
References
Argo Data Management. “Argo User’s Manual.” Ifremer, July 5, 2022. https://doi.org/10.13155/29825.
Kelley, D. E., Harbin, J., & Richards, C. (2021). argoFloats: An R package for analyzing Argo data. Frontiers in Marine Science, (8), 636922. doi:10.3389/fmars.2021.635922
Examples
# Demonstrate applyQC to a built-in file
library(argoFloats)
f <- system.file("extdata", "SR2902204_131.nc", package = "argoFloats")
raw <- readProfiles(f)
#> Warning: Of 1 profiles read, 1 has >10% of BBP700 values with QC flag of 4, signalling bad data.
#>     The indices of the bad profiles are as follows.
#>     1
#> Warning: Of 1 profiles read, 1 has >10% of chlorophyllA values with QC flag of 4, signalling bad data.
#>     The indices of the bad profiles are as follows.
#>     1
#> Warning: Of 1 profiles read, 1 has >10% of oxygen values with QC flag of 4, signalling bad data.
#>     The indices of the bad profiles are as follows.
#>     1
#> Warning: Of 1 profiles read, 1 has >10% of pressure values with QC flag of 4, signalling bad data.
#>     The indices of the bad profiles are as follows.
#>     1
clean <- applyQC(raw)
oldpar <- par(no.readonly = TRUE)
par(mar = c(3.3, 3.3, 1, 1), mgp = c(2, 0.7, 0))
plot(raw, col = "red", which = "TS")
#> NULL
points(clean[[1]][["SA"]], clean[[1]][["CT"]], pch = 20)
legend("topleft",
    pch = 20, cex = 1,
    col = c("black", "red"), legend = c("OK", "Flagged"), bg = "white"
)

par(oldpar)